
- ARYA LAYA
- Packaging
- vitaminwater
- Digital
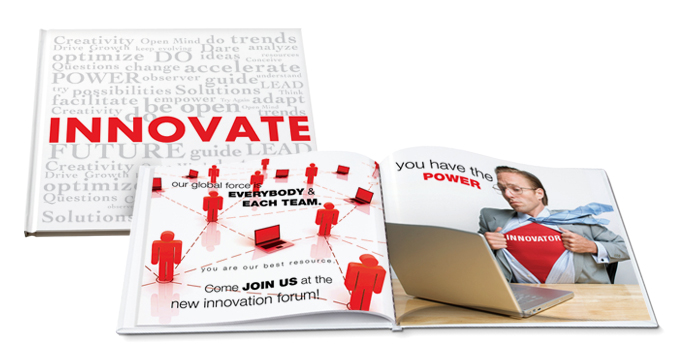
- Innovation
- Global Capabilities
- DILG
- Research Visualization
- Unisource
- Logos and Icons

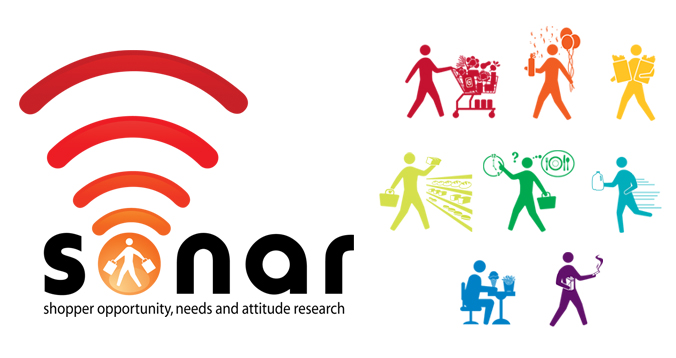
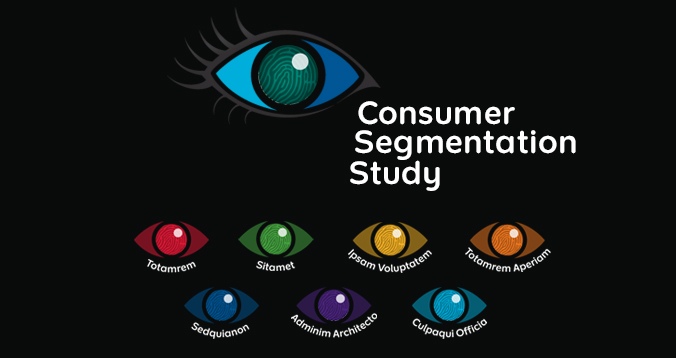
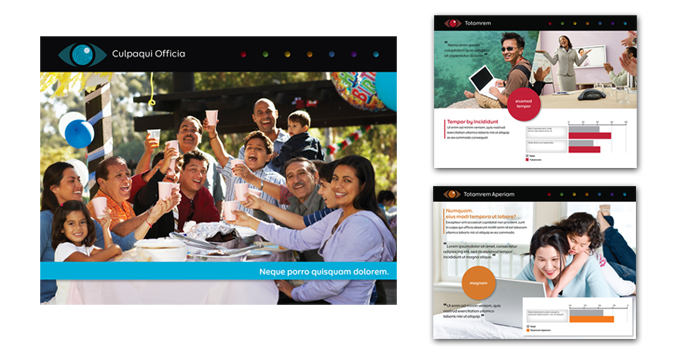
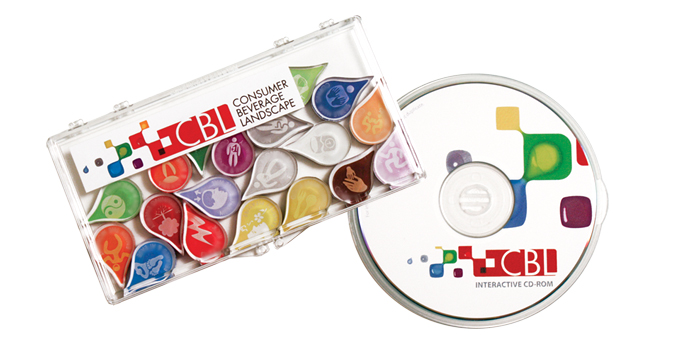
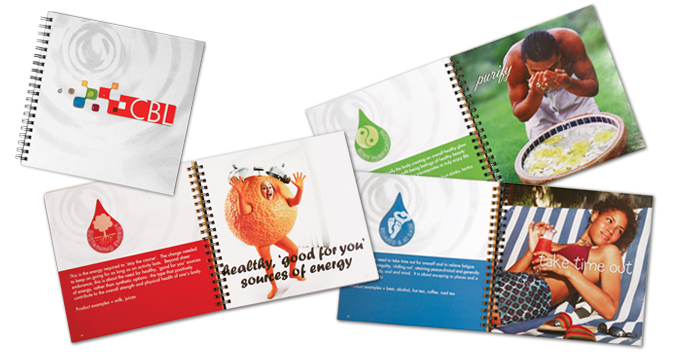
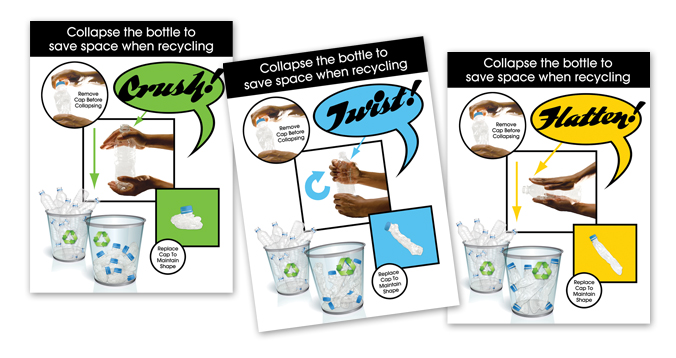
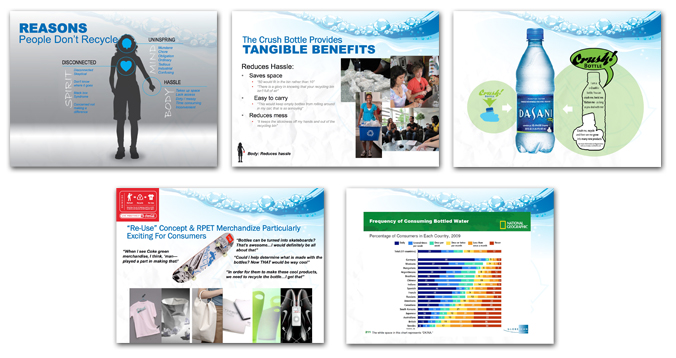
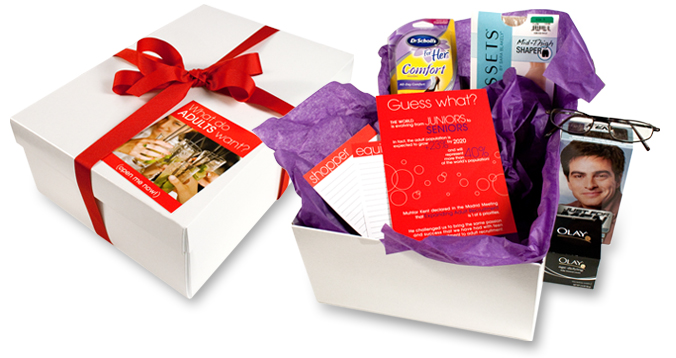


Research Visualization
You’ve spent months (maybe more) working with your research team to better understand the intricate details of your brand’s positioning-- who are your consumers; how do they feel about your brand; your packaging; what drives them to purchase; what sends them in the direction of your competitor?
Now that you have the holy grail of intel you are ready to show your boss what a rockstar you are. Congratulations! However that 300MB data file of statistics and graphs that you sent never got opened. And neither did the 8 inch thick printout that you left on her desk. Why? Because it’s a TON of information and not everyone has the time or proficiency to process all of those charts and numbers.
That’s where unitOne comes in. We’ll take your research and present it in a way that communicates its value to your audience—we’ll also give it the visual sizzle and emotional appeal to make it enjoyable to digest. Now everyone is celebrating you for the critical information that you have mined— in fact there’s a pizza party in the breakroom in your honor because Q2 results are in and sales are UP! Good Job!